Case study · Concept · Web
Every GPU, every tenant, one view
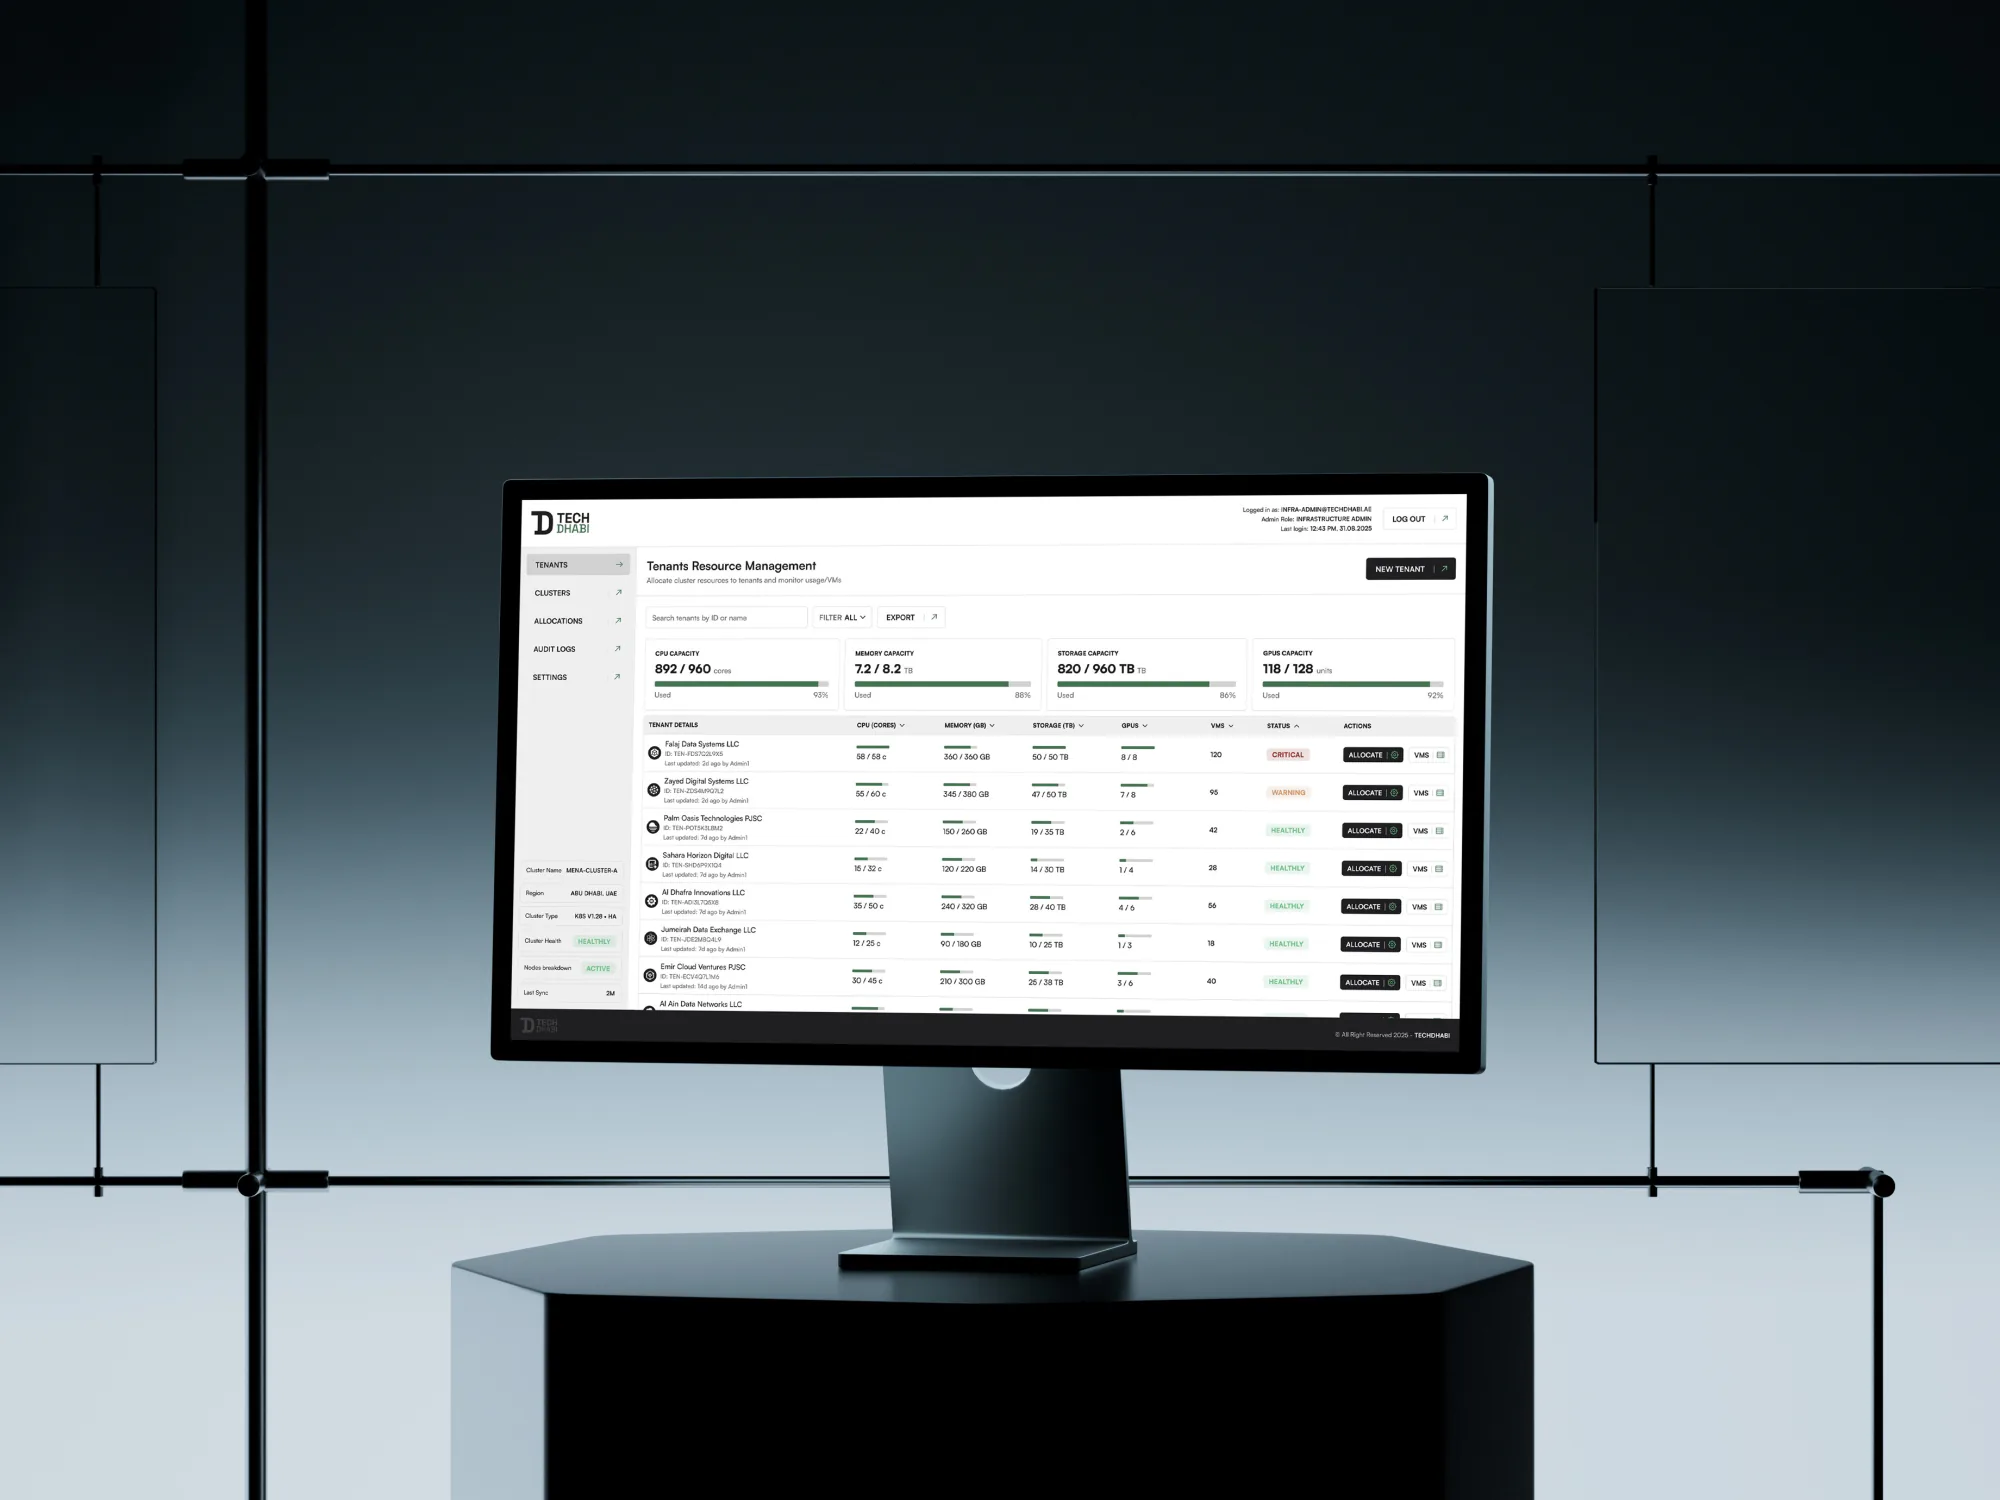
A concept dashboard for the people who share GPUs, memory and storage across many tenants: one view of who has what, and one step to change it.
00 Overview
- Problem
- Administrators sharing AI infrastructure had no single view of who had what, little live status, and slow, many-step changes.
- My role
- Product designer, end to end: workflow research, flows, interface and the component system.
- What I did
- An overview with live usage beside every tenant, one dialog to change an allocation, and a token-based component library.
- Outcome
- Four screens and their components, ready to build. A concept: not shipped, no usage numbers.
01 Context
AI runs on shared machines
AI work runs on clusters of GPUs far too expensive to give every team its own. In May 2025, Abu Dhabi announced a 1-gigawatt AI cluster as the first part of a 5-gigawatt campus (SoftBank, 2025). At that scale every GPU is shared, and someone decides who gets what.
Who it’s for
- The administratorShares a fixed pool between tenants and answers for what runs out. The one persona this concept is built for.
- The tenantA team or a company whose workload grows without warning and needs more now.
- Whoever paysPays for what is allocated, used or not, so idle capacity has a cost.
02 Research
The workflow
I started from the administrator’s existing workflow, a loop of four steps: look, decide, change, check. Four things slowed that loop down.
- No single viewHow resources were shared across tenants lived in several places.
- Status out of sightLive health and usage had to be looked for, so problems were found late.
- Many steps to changeGiving or taking back resources meant long, separate flows.
- Every module differentNo shared design system: components were duplicated and patterns drifted.
What the administrator asks
- Who is using what, right now?
- Is anything about to run out?
- How do I give this tenant more, safely?
Everything else can wait a click. These three questions became the brief.
03 Define
The question
How might one dashboard make allocation and monitoring simple, and stay consistent as the platform grows?
Principles
- Status next to the thingUsage sits in the same row as the tenant it describes, never on another page.
- One step for the common changeGiving a tenant more is one dialog, not a flow.
- Danger apartTaking resources away is never beside the main action.
- Same parts everywhereEvery screen is built from the same tokens and components.
How success would be measured
- Overview
- The three questions answered in seconds, without opening a tenant
- Change
- One dialog to give a tenant more, with what’s left in view
- Safety
- No allocation removed by a misplaced click
- Growth
- A new module built from the existing parts
04 Explore
Structure
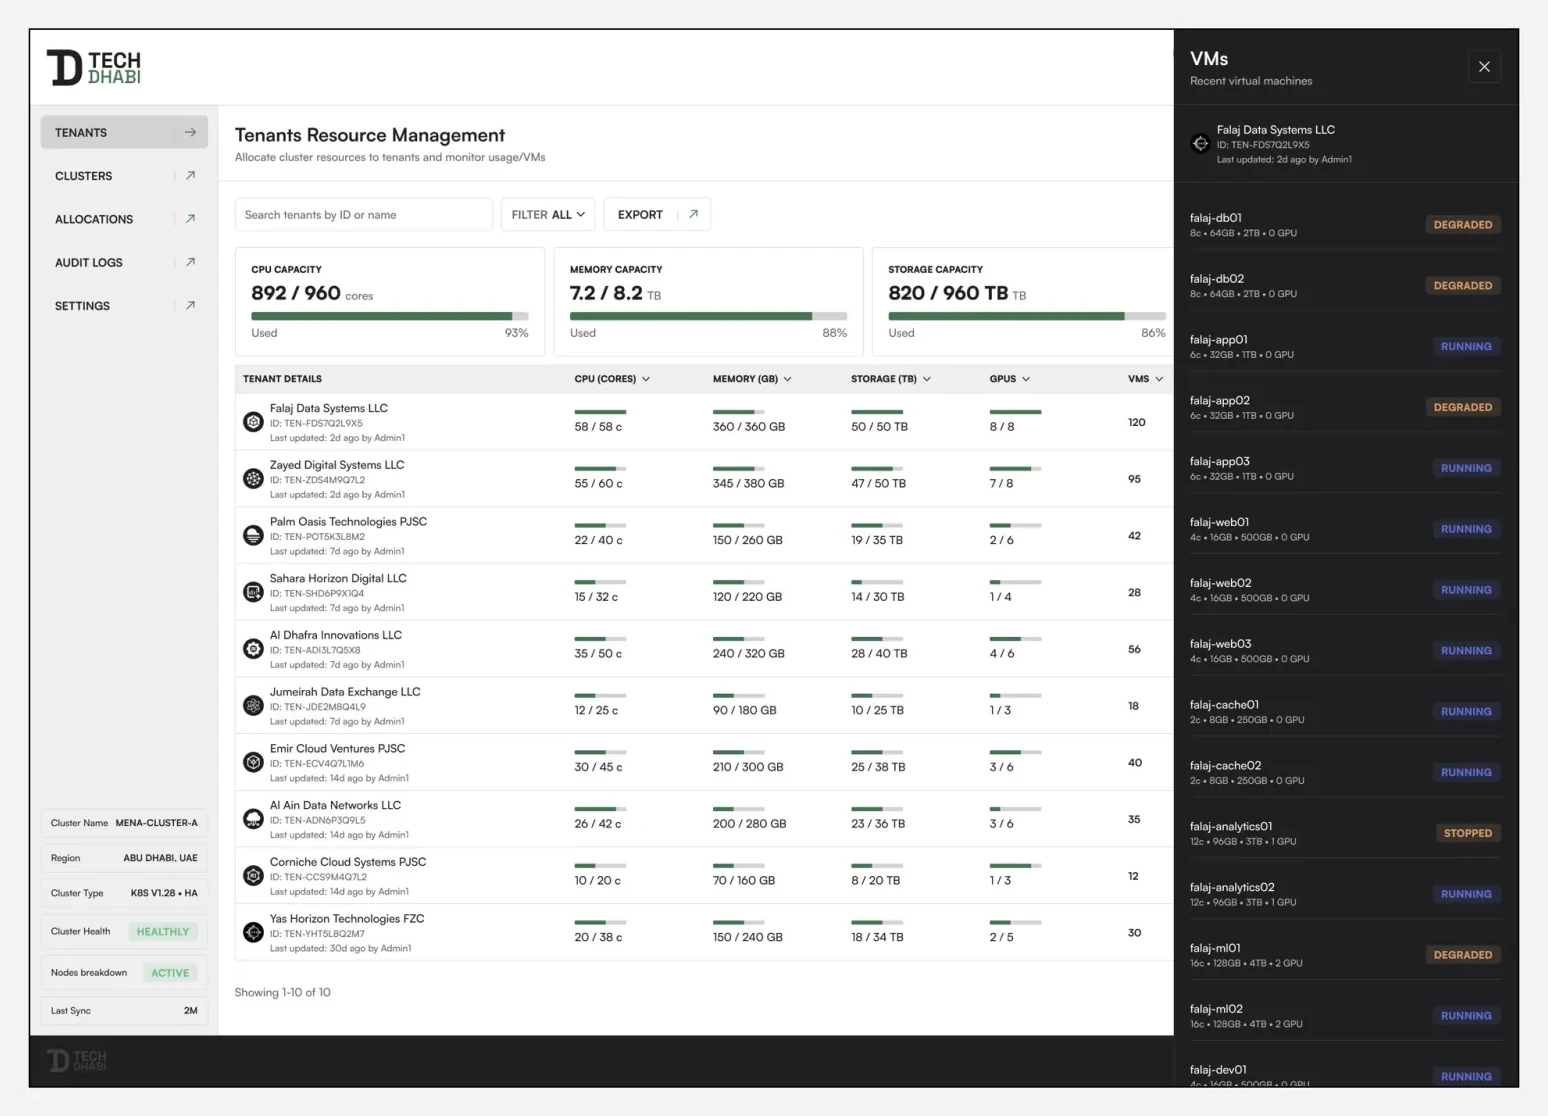
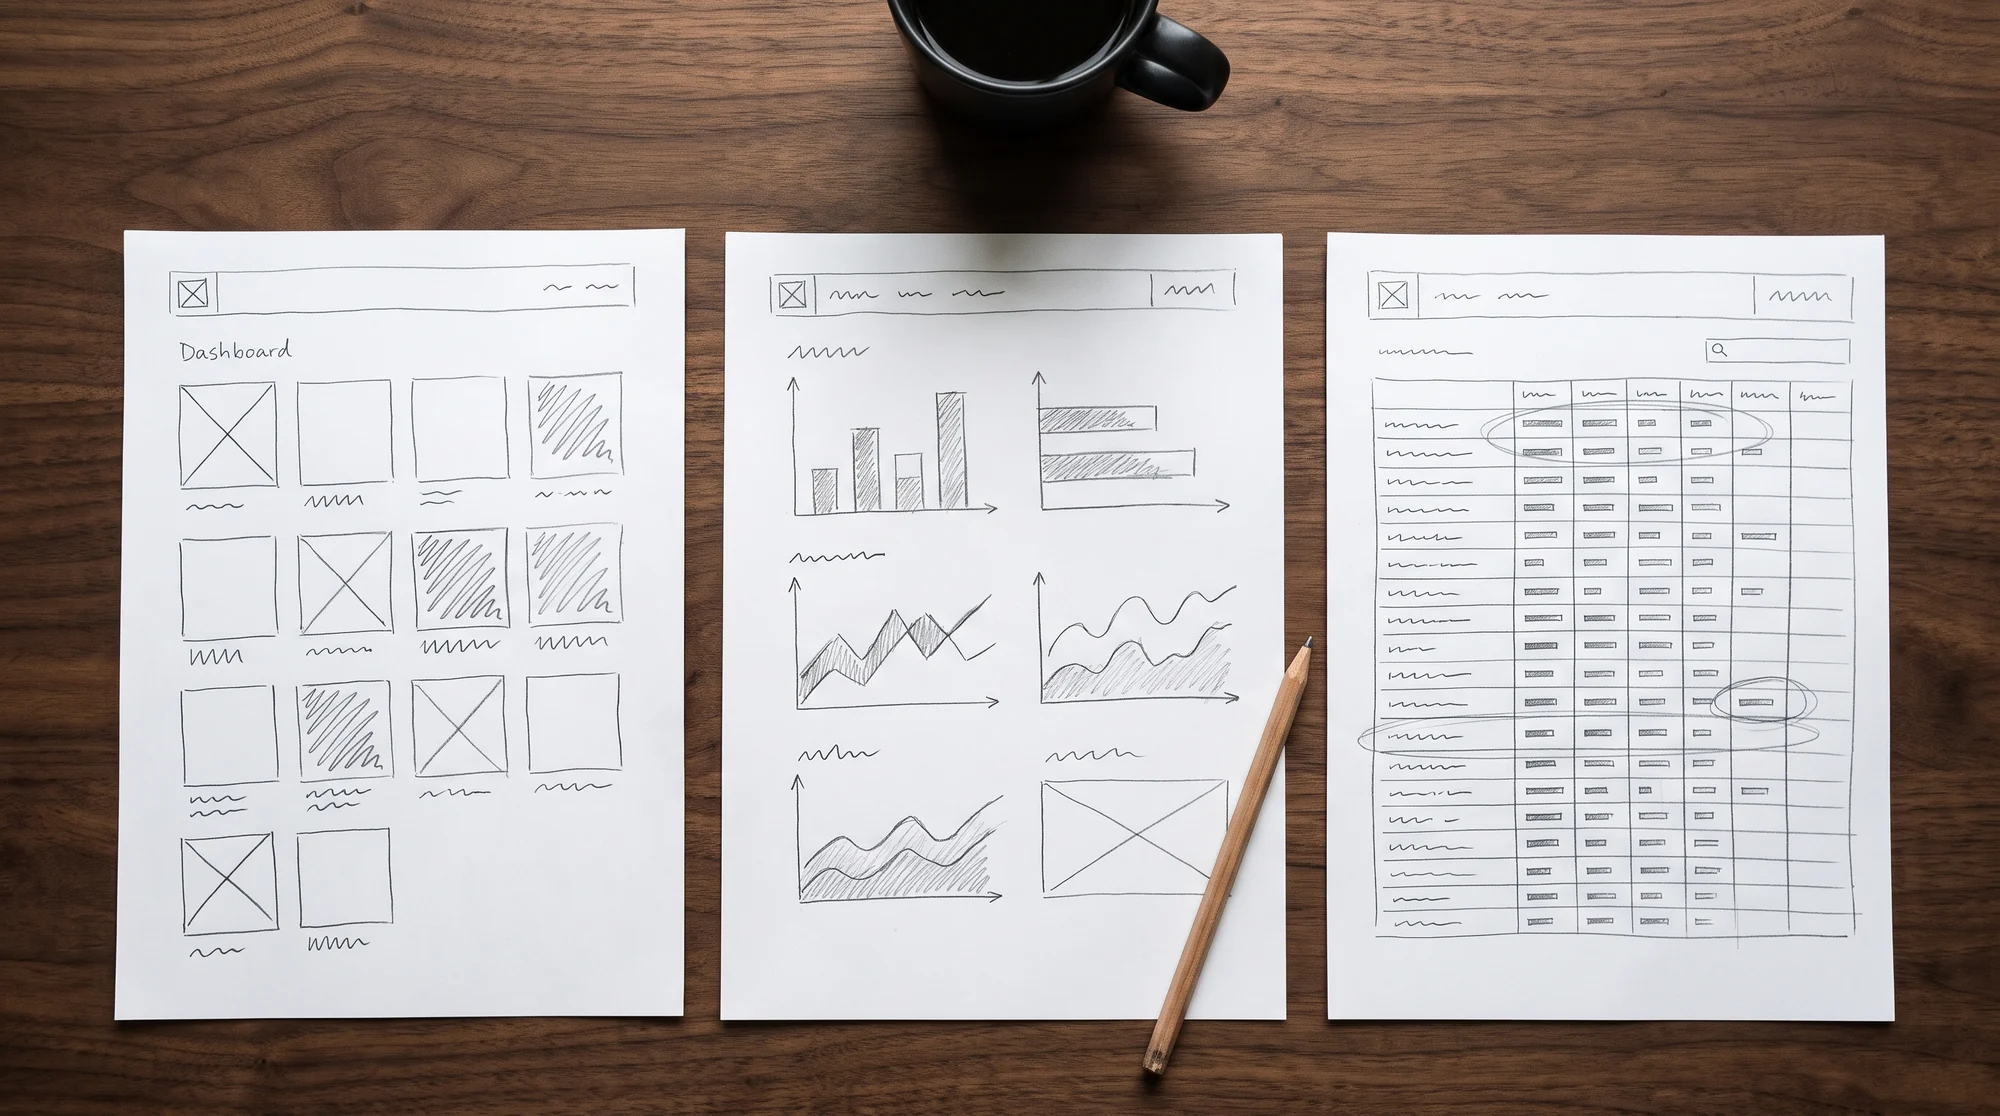
The overview became a table: tenants as rows, resources as columns, so every tenant can be compared with every other at a glance. Details open in a side panel, so the list never disappears.
Key decisions
- Tenants as rows, resources as columnsComparison is the main task. A table makes it one glance.Instead of: a card per tenant
- Usage bars inside the tableThe number and what it means, read together.Instead of: a separate charts page
- A side panel for detailsLook closer without leaving the list.Instead of: a page per tenant
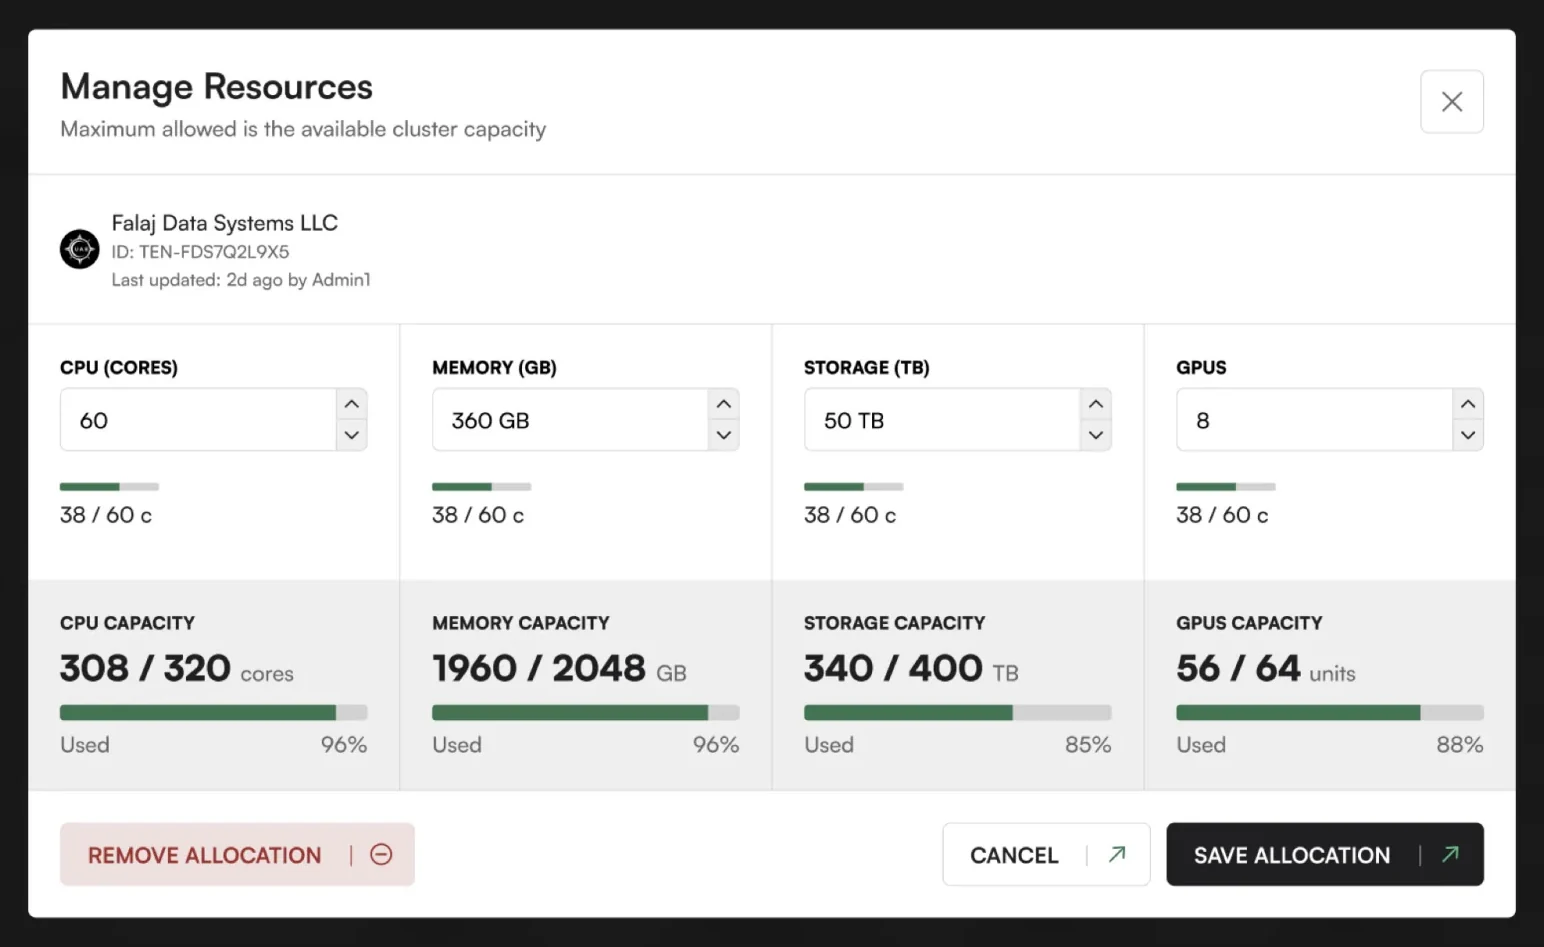
- One dialog for every resourceCPU, memory, storage and GPUs together, each with what’s left.Instead of: a form per resource
- Remove set apart from SaveThe destructive action can’t be pressed by habit.Instead of: a row of equal buttons
05 Design
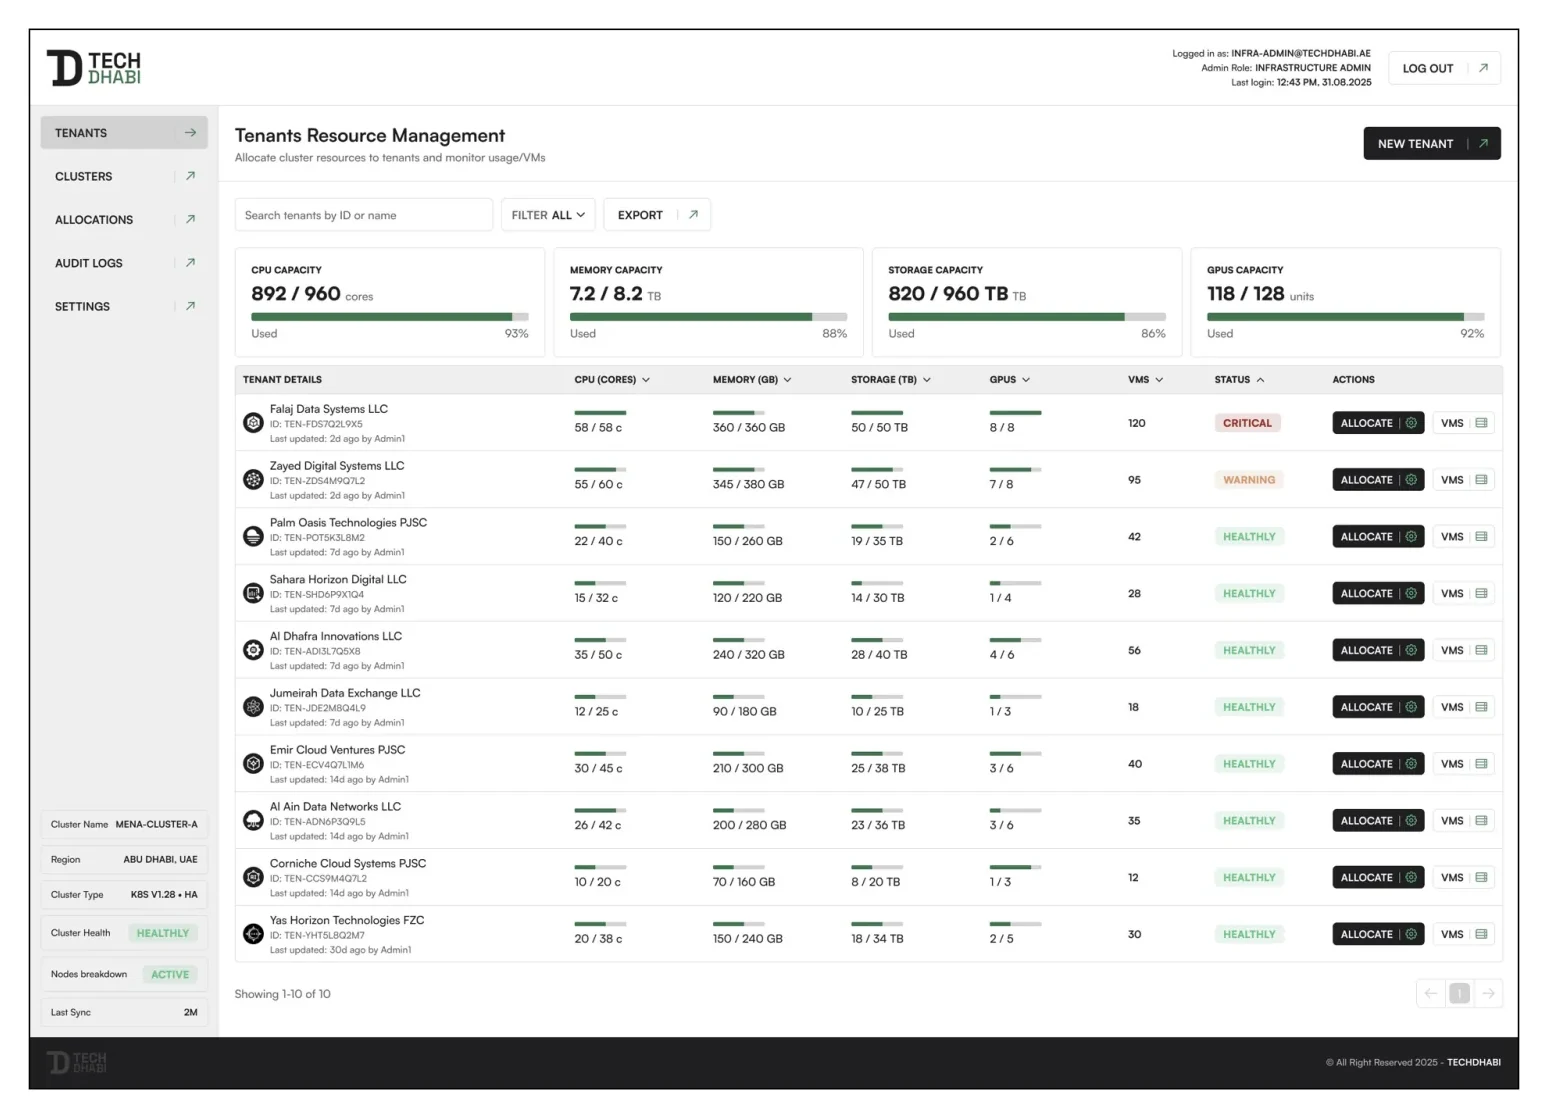
The tenant table
Every tenant on one screen. CPU cores, memory, storage and GPUs are columns. Each cell shows what is used of what is given, as a number and a bar. Live status ends each row, so a tenant near its limit is visible before anyone looks for it.
Allocation in one step
Giving a tenant more is a single dialog. Each resource has its own control with its total and what’s used beside it, so the administrator sees what is left before committing, then saves once. Removing an allocation sits apart, on the other side.
The system underneath
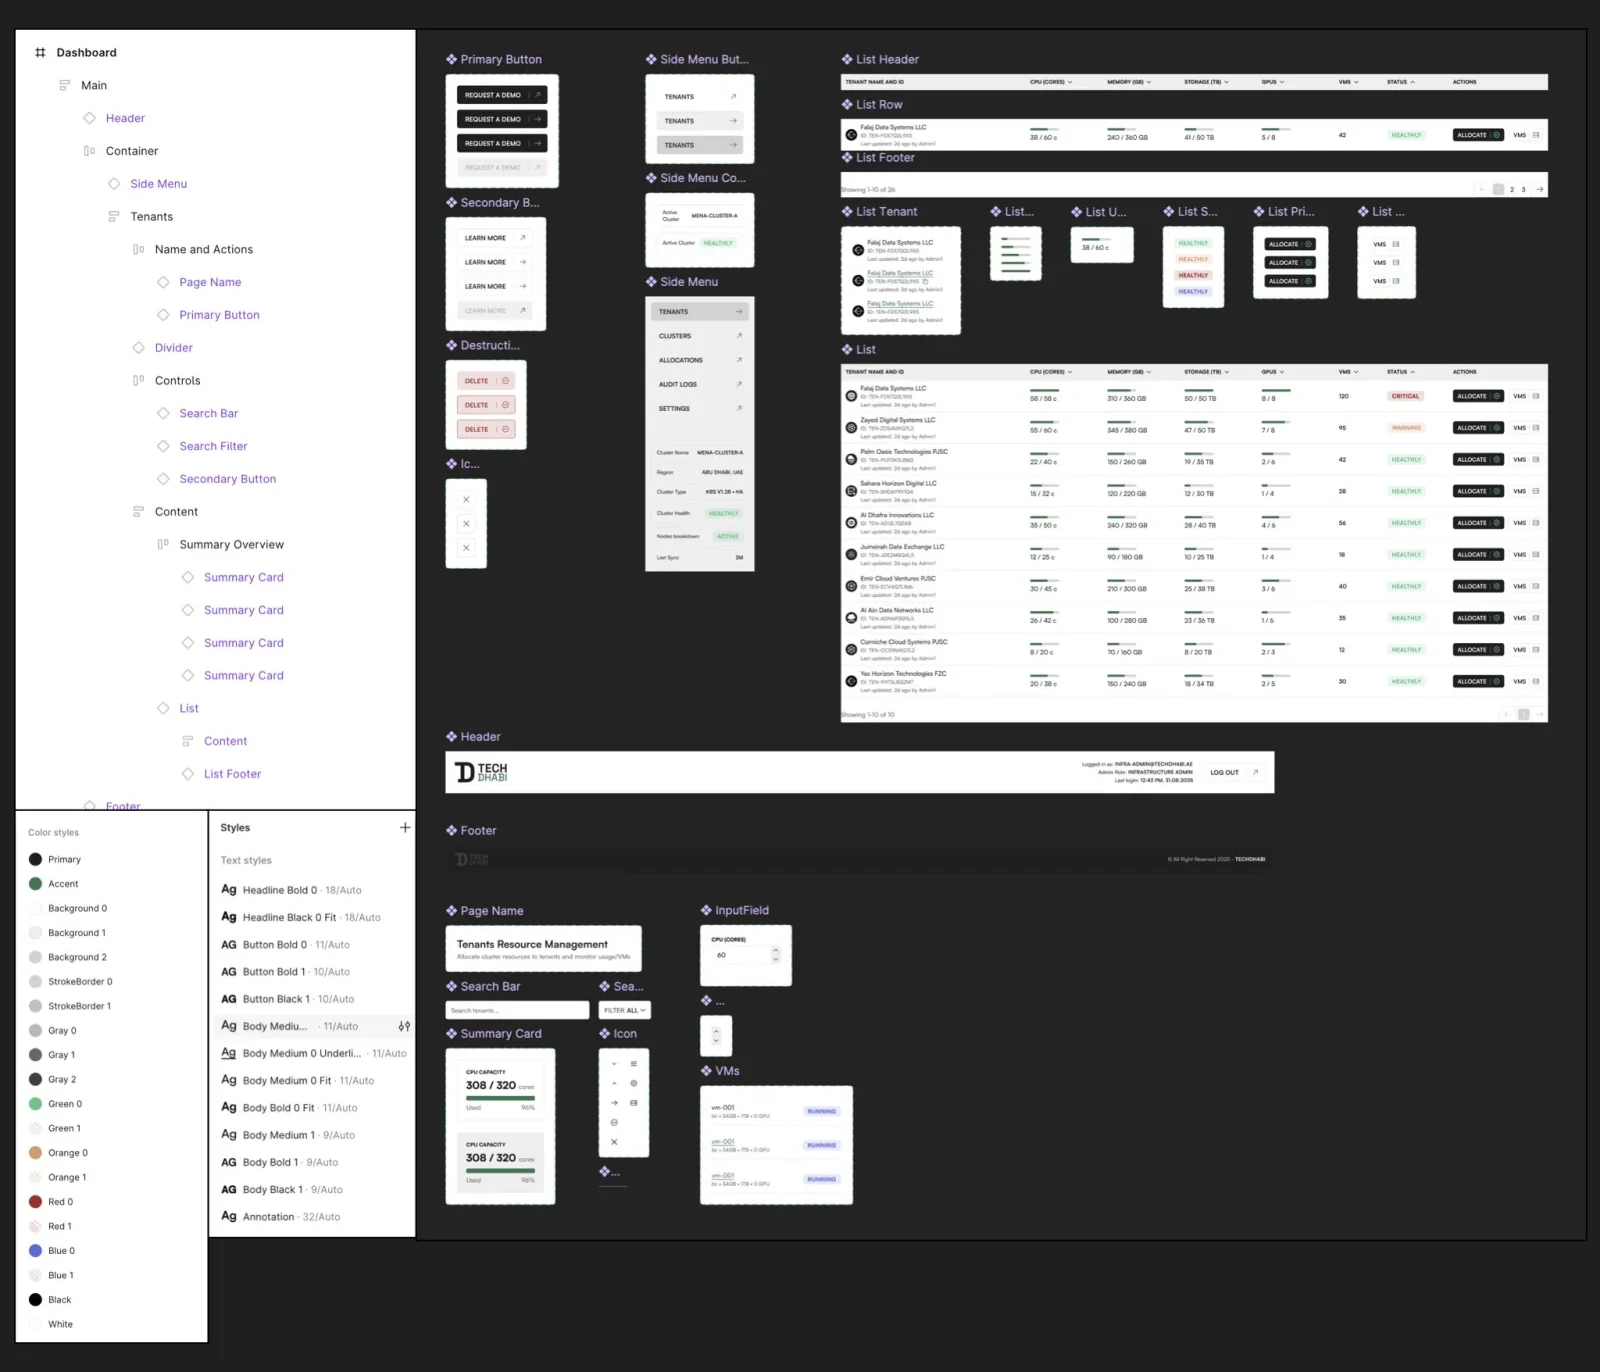
- Tokens for type, colour, spacing and elevation: one visual language in every module.
- Components with named variants and states, replacing the duplicated patterns.
- Notes for the engineers, so design and development talk about the same parts.
06 Details
Edge cases the design handles
- Asking for more than is leftEach control shows its total and what’s used, so the limit is visible before Save.
- Taking resources backRemove allocation is apart from Save and Cancel, so it is never a reflex.
- A tenant close to its limitIts row says so with the bar and the status, on the overview itself.
Accessibility: what I’d check now
- Colour and wordsEvery status shown in colour should also say it in words.
- KeyboardAllocation done end to end without a mouse, focus kept inside the dialog.
- Dense tablesReadable at 200% zoom, with the header row kept in view.
07 Result
As a concept, TechDhabi wasn’t shipped and has no usage numbers. It delivered four screens, two flows and the component library behind them, ready to build.
- Next: predicting what a tenant will need before it runs out.
- Alerts before a limit is reached, not after.
- A history of every change, so every allocation can be traced.
08 Reflection
Allocation can be one step instead of many, and live status belongs next to what it describes. A small token-based system makes every screen after the first faster.
What I’d do differently: time the three questions in today’s tools first, to have a baseline, and test the overview with three administrators before designing the dialog.